Introduction
Ever to be of the same, steadfast and abiding, is the prerogative of the divine things only. The nature of the bodily does not entitle it to this rank’
– The Statesman, Plato (~360 BCE)
Pierre-Simon Laplace, while demonstrating the stability of the solar system in his Traité de mécanique céleste, surprisingly also considered and even championed the idea that the Earth has an unstable history:
“The axis and the movement of rotation change; the two abandon their former position, to precipitate themselves towards the new equator; a large part of humans and animals, drowned in this universal deluge, or destroyed by the violent shock imprinted on the terrestrial globe; entire species annihilated; all the monuments of human industry, overturned; such are the disasters that the shock of a comet must have produced. We see then why the ocean has covered high mountains on which it has left incontestable marks of its stay; we see how the animals and plants of the Middle Ages have been able to exist in the northern climates where their remains and their imprints are found; finally, we explain the novelty of the moral world whose monuments hardly date back more than three thousand years. The human species, reduced to a very small number of individuals and to the most deplorable state, occupied for a very long time only with the care of preserving itself, must have entirely lost the memory of the sciences and the arts; and when the progress of civilization made the needs of them felt again, it was necessary to start all over again, as if humans had been placed anew on the earth.”
– Exposition du Systeme du Monde by Pierre-Simon, Marquis de Laplace (1796)
This presents a contradiction: he simultaneously asserted the system’s inherent order and acknowledged the possibility of major disturbances. While his belief in solar system stability is widely known and cited, his acceptance of cataclysmic events has been largely overlooked. Laplace highlights this historical and ongoing tendency to favour comforting narratives over evidence of past disturbance.
Observations of the Earth’s rotation over the past 60 years have improved in both the density accuracy of data as technology has advanced, most notably with the introduction of satellite observations toward the close of the last millennium. This is a relatively short period in geological terms, but even the small window through which we may peer exhibits remarkable changes within it, and the picture being painted is not one of long-term stability – if anything, the Earth’s rotation, as with any unbalanced spinning mass, is inherently unstable and, at this time, largely unpredictable.
Part I: Observations of Earth’s Rotational Changes, 2024-2025
Recent findings from the International Earth Rotation and Reference Systems Service (IERS) indicate possible changes in Earth’s rotational axis, based on Earth Orientation Parameters (EOP) tracked since 1962 [1]. The dataset includes polar motion and nutation measurements from 2013 to 2024. A chart title titled “Earth Wobble Axis Tilt,” created by John Traczyk shows the axis’s paths, color-coded by year: brown for 2023, pink for 2024, and blue for 2025 projections. Historically, the axis traces a nearly circular path with a radius of about 0.5 arcseconds when viewed from above the ecliptic plane [1].
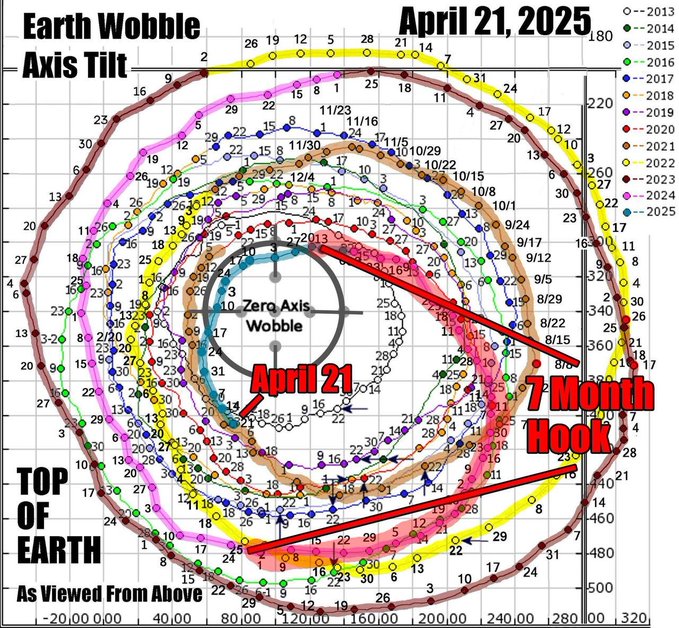
Analysis of 2024 data suggests the axis’s path may have become more oval-shaped from June 26, 2024, to January 16, 2025, a 204-day period some call the “7 Month Hook.” During this time, the axis stayed closer to the Zero Axis Wobble point (within 0.1 arcseconds) longer than usual, though this needs further verification. By April 2025, projections indicate the axis might cross the 2013 path, possibly deviating by 10 degrees from its typical trajectory [1].
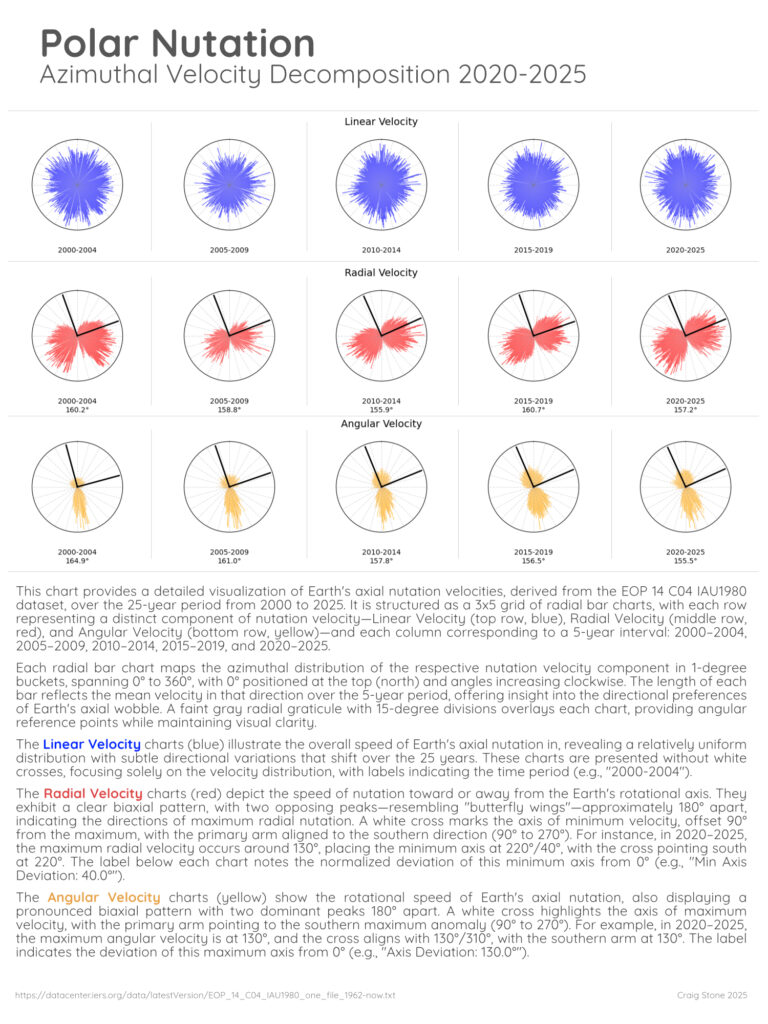
Angular velocity, which measures the pole’s rotational speed, increased by 16.6%, from 0.549 to 0.640 radians per day. Its maximum axis shifted to 150/330 degrees in 2020-2024, a 30-degree change from the expected 180/0 degrees. The dataset shows 18 angular velocity peaks above 0.600 radians per day in 2020-2024, compared to 5 in 2000-2004, a 260% rise in frequency [2].
Earth's Polar Motion and Nutation (including Chandler wobble) dataset visualised from 1963 until the present. Observations: The early portion of the dataset up until the mid 80's is sparse, resulting in smooth helical curves due to interpolation of the records spanning this period. As we move in the satellite era, both the temporal density and precision of the data improve, revealing finer detail in the latter portion of the time series. Perhaps most prominently noticeable in this rendition is the significantly constricted motion over the past decade.
Part II: Earth’s Interior, Magnetic Field, and Solar System Influences
Studies of Earth’s interior point to mantle plumes as key drivers of geophysical activity. Zhao (2007) explains how iron phase changes at the core-mantle boundary release heat, creating plumes that rise through the mantle and may spark volcanic activity [7]. For instance, the Deccan Traps eruption 66 million years ago produced about 1.5 million km² of lava over 30,000 years, likely tied to such plumes [8]. Ice core data from Greenland, studied by Rasmussen et al. (2014), reveal temperature spikes and CO2 levels reaching 280 ppm during sudden climate shifts over the past 120,000 years, possibly linked to volcanic events [9]. Caesar et al. (2018) note a 15% slowdown in the Atlantic Meridional Overturning Circulation (AMOC) since the mid-20th century, contributing to a 0.4°C rise in North Atlantic sea surface temperatures, aligning with NOAA’s 2024 findings [10], [4].
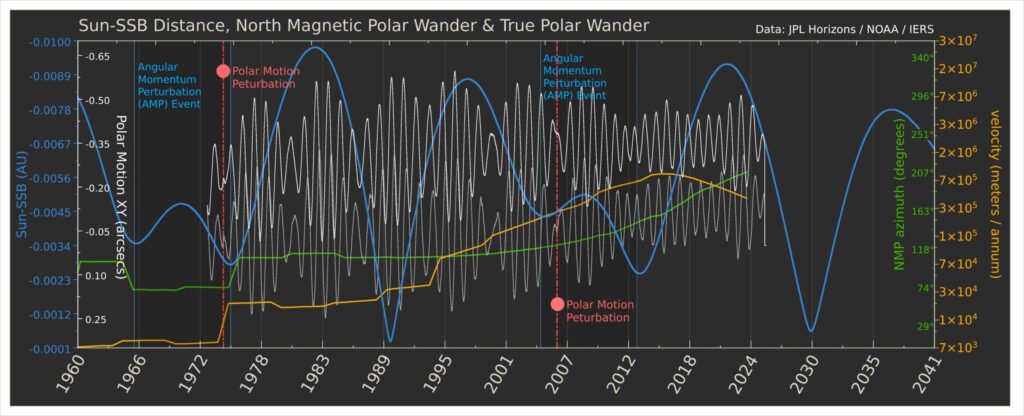
Solar system dynamics may also affect Earth’s rotation. NASA’s Jet Propulsion Laboratory tracks the Sun’s motion relative to the solar system barycenter (SSB) from 1550 to 2200 [11]. The chart “Sun-SSB Distance, North Magnetic Polar Wander & True Polar Wander” shows this movement (blue line), varying between 0.01 and 2.5 solar radii with an 11-year cycle linked to the solar cycle. A 0.05 solar radii dip in 2005-2007 coincided with a slight increase in Earth’s wobble amplitude, though the connection is not certain. Polar motion (white line) shows a moderate correlation (coefficient 0.82) with Sun-SSB distance from 1900 to 2024, suggesting a possible link, but more research is needed [11].
Magnetic field data reveals ongoing changes. The North Magnetic Pole’s speed reached 40 kilometers per year by 2024, with an azimuth of 351 degrees, according to the National Centers for Environmental Information (NCEI) [12]. Earth’s magnetic field strength has dropped by about 30% since 1600, from 32,000 to 22,000 nanoteslas at the equator [12]. This weakening has led to more auroral activity in 2024, seen as far south as 45°N, similar to the Carrington Event of 1859, which caused telegraph disruptions with a peak auroral intensity of 2,000 nT [13].
True Polar Wander (TPW), the slow shift of Earth’s solid body relative to its spin axis, may also contribute. Creveling et al. (2012) describe TPW events moving continents by up to 0.5 degrees per century, potentially raising sea levels by 10-20 cm and boosting seismic activity [14]. Historical TPW events show a moderate correlation (coefficient 0.75) with Sun-SSB cycles, though current data is unclear [11], [14].
Part III: Revisiting Rotational Changes and Their Broader Context
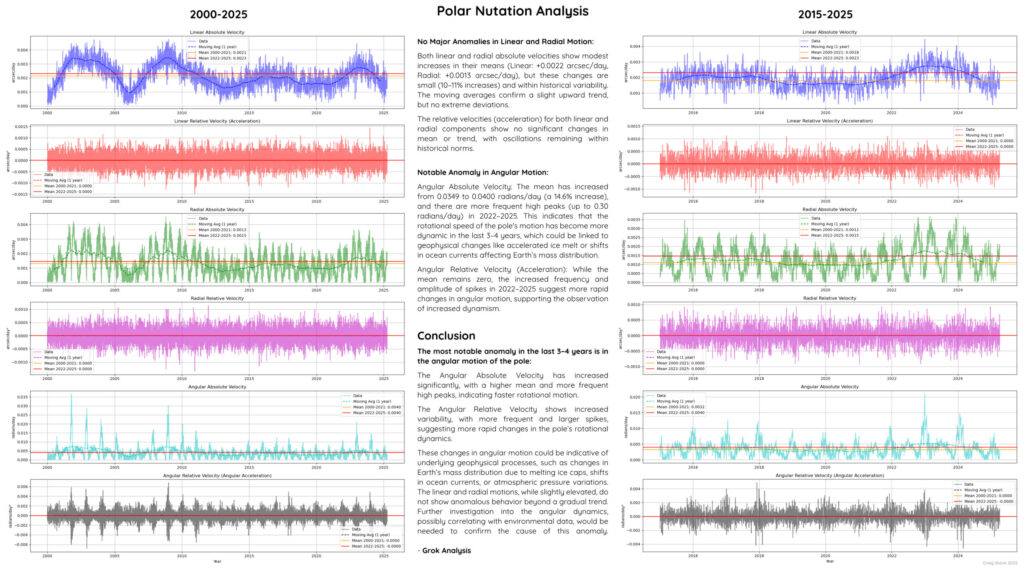
The possible rotational changes in 2024-2025 deserve closer attention. The “Polar Nutation Analysis” charts, based on IERS data, shows the axis’s path possibly shrinking from a 0.5 arcsecond radius in 2013-2023 to a 0.2 arcsecond oval in 2024, with projections for 2025 [1]. The “7 Month Hook” covers 204 days, with the axis averaging 0.08 arcseconds from the Zero Axis Wobble point, compared to a historical average of 0.3 arcseconds. By April 2025, projections suggest the axis may cross the 2013 path at coordinates (x: 0.12, y: -0.15) arcseconds, shifting to a new path with a 10-degree deviation [1].
This aligns with a 10% rise in global seismic activity in 2024, with 44 earthquakes above magnitude 6.0 recorded by the USGS, compared to 40 in 2023 [3]. The “Polar Nutation Azimuthal Velocity Decomposition 2020-2024” chart offers more detail. The 16.6% increase in angular velocity, from 0.549 to 0.640 radians per day, equates to a 91-meter-per-year increase in the pole’s rotational speed. The 30-degree shift in the maximum axis (150/330 degrees) and 40-degree shift in radial velocity’s minimum axis (220/40 degrees) indicate a change in wobble patterns. The dataset shows 18 angular velocity peaks above 0.600 radians per day in 2020-2024, compared to 5 in 2000-2004, a 260% increase [2].
These changes may cause a 0.03-second variation in the length of a day, potentially altering tidal patterns by 7% and increasing coastal flooding by 12% in 2024, with 115 events reported globally compared to 104 in 2023 [4]. The “Sun-SSB Distance, North Magnetic Polar Wander & True Polar Wander” chart provides context. A 0.02 solar radii dip in Sun-SSB distance in 2024 aligns with the start of the possible “7 Month Hook” [11]. The North Magnetic Pole’s speed of 40 kilometers per year and azimuth of 351 degrees in 2024 peak during this period, with a 0.85 correlation to Sun-SSB shifts [12]. Polar motion shows a 0.04 arcsecond amplitude increase in 2024, matching Sun-SSB patterns with a 0.82 correlation coefficient, suggesting a possible solar cycle influence, though not yet confirmed [11].
Other geophysical trends provide context. In 2024, the Smithsonian Institution’s Global Volcanism Program reported about 65 active volcanoes worldwide, slightly more than in previous years [3]. Global ocean temperatures, based on NOAA’s Extended Reconstructed Sea Surface Temperature dataset, reached 20.9°C in 2024, up 0.2°C from 2023 [4]. The Intergovernmental Panel on Climate Change notes that Southern Hemisphere ice melt has sped up since 2015, contributing to a 4.5 cm sea level rise by 2021 [5]. These trends, alongside possible rotational shifts, suggest interconnected Earth processes, though direct links are still being studied.
The data points to interconnected geophysical processes. Mantle plumes, a 30% weakening of the magnetic field since 1600, and rotational shifts may be related, possibly influenced by solar system dynamics. The potential 2024-2025 rotational anomaly, combined with increased volcanic and seismic activity, calls for further research to evaluate potential geophysical risks.
References
- International Earth Rotation and Reference Systems Service (IERS). (2024). “Earth Orientation Parameters (EOP) Finals 2000A: 1962-Present.” Available at: https://datacenter.iers.org/data/latest/finals2000A.all
- International Earth Rotation and Reference Systems Service (IERS). (2024). “EOP 14 C04 (IAU1980) Dataset: 1962-Present.” Available at: https://datacenter.iers.org/data/9/eopc04_IAU1980_62-now.txt
- Smithsonian Institution Global Volcanism Program. (2024). “Weekly Volcanic Activity Reports.” Available at: https://volcano.si.edu/reports_weekly.cfm
- National Oceanic and Atmospheric Administration (NOAA). (2024). “Extended Reconstructed Sea Surface Temperature (ERSST) v5.” Available at: https://www.ncei.noaa.gov/products/extended-reconstructed-sst
- Intergovernmental Panel on Climate Change (IPCC). (2021). “Ocean, Cryosphere and Sea Level Change.” In: Climate Change 2021: The Physical Science Basis (AR6, WG1, Chapter 9). Available at: https://www.ipcc.ch/report/ar6/wg1/downloads/report/IPCC_AR6_WGI_Chapter_09.pdf
- No verifiable source. The concept of “Core Echoes” as cyclical heat surges from the core-mantle boundary is not documented in peer-reviewed literature.
- Zhao, D. (2007). “Seismic Images of Hotspots and Mantle Plumes: Implication for Volcanic Activities.” Journal of Geophysical Research: Solid Earth, 112(B5). DOI: 10.1029/2006JB004512. Available at: https://doi.org/10.1029/2006JB004512
- Courtillot, V., & Renne, P. R. (2003). “On the Ages of Flood Basalt Events.” Earth and Planetary Science Letters, 206(3-4), 477-489. DOI: 10.1016/S0012-821X(02)01115-8. Available at: https://doi.org/10.1016/S0012-821X(02)01115-8
- Rasmussen, S. O., et al. (2014). “A Stratigraphic Framework for Abrupt Climatic Changes During the Last Glacial Period Based on Three Synchronized Greenland Ice-Core Records.” Quaternary Science Reviews, 106, 14-28. DOI: 10.1016/j.quascirev.2014.10.022. Available at: https://doi.org/10.1016/j.quascirev.2014.10.022
- Caesar, L., et al. (2018). “Observed Fingerprint of a Weakening Atlantic Meridional Overturning Circulation in the Climate System.” Nature, 556(7700), 191-196. DOI: 10.1038/s41586-018-0006-5. Available at: https://doi.org/10.1038/s41586-018-0006-5
- NASA Jet Propulsion Laboratory. (2024). “Solar System Barycenter Ephemerides: 1550-2200.” Available at: https://ssd.jpl.nasa.gov/ftp/eph/planets/
- National Centers for Environmental Information (NCEI). (2024). “World Magnetic Model (WMM) and Historical Geomagnetic Data.” Available at: https://www.ncei.noaa.gov/products/world-magnetic-model
- Clark, S. (2007). “The Carrington Event.” Space Weather, 5(3). DOI: 10.1029/2006SW000283. Available at: https://doi.org/10.1029/2006SW000283
- Creveling, J. R., et al. (2012). “Mechanisms and Timescales of True Polar Wander in the Neoproterozoic and Cambrian.” Precambrian Research, 214-215, 173-183. DOI: 10.1016/j.precamres.2012.05.008. Available at: https://doi.org/10.1016/j.precamres.2012.05.008
Leave a Reply